![]()
|
|
|
|
Examples Parameter Description Advanced Settings Typical Settings Results Table
Trendlines are one of the most important tools of Technical Analysis, yet are quite simple in construction. They are drawn by connecting a series of recent lows or highs with a straight line. It is amazing to watch stocks repeatedly bounce off a trendline, and then fall or rise dramatically when they break this trendline. When both upper and lower trendline are drawn, patterns appear in the charts which can be interpreted with Technical Analysis principles, for example, descending triangles typically break down.
Trendlines and chart patterns should form a large part of your trading arsenal, and we strongly recommend that you study books such as "Encyclopedia of Chart Patterns" by Thomas Bulkowski and John Murphy's "Technical Analysis of the Financial Markets."
A major problem with trendlines is
that they are often subjective - different people can look
at the same chart and draw quite different lines.
Furthermore, until you actually draw trendlines on the
chart it is easy to miss them, and thereby miss
potentially-profitable trades. TCScan+ solves these
problems by always drawing the trendlines in a systematic,
objective manner. Furthermore, it creates upper and
lower trendlines for all the items in your selected
lists, and lets you know when the item's price is close to one
of the lines. You then have a shortlist of
high-probability trades to consider, rather than your whole
list to click through, manually looking for
trendlines. Click Here
for some trendline scan examples. ![]()
The Trendline Tab allows you to set the parameters for your Trendline scan. You can specify parameters for both the upper and lower trendlines, and also how the trendlines relate to each other. For each trendline, you can define its trend, how long or short it should be, how many touches are needed to create it, whether it has been broken (violated), and whether to check for proximity near it. There are also a number of advanced settings that allow you to fine-tune the type of trendlines to find, and how to display them on your chart.
|
|
Up/Down/Flat You can check any or all of these checkboxes to find upwards, downwards or sideways sloping lower or upper trendlines. The box following the 'Flat' checkbox is used to specify the tolerance for what creates a horizontal trendlines. This tolerance parameter is also applicable to the 'Up' and 'Down' sloping checkboxes too, as described in the Price Trend section. |
|
|
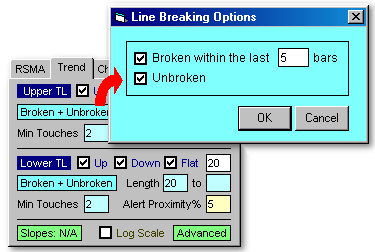
Broken + Unbroken
clicking this label will open a form allowing you to specify whether the
particular trendline can be broken or unbroken, and if broken, when it is
allowed to have been broken. If you don't care where the break occurred, then set
this level equal to the lookback period. |
|
|
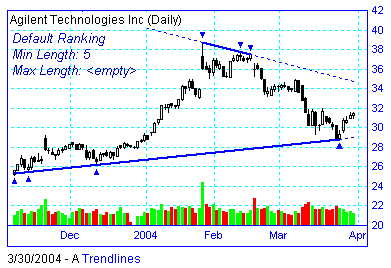
Minimum Length
specifies the shortest length the trendline should
be. It helps you to specify longer versus shorter-term trendlines.
For example the two charts below show the best trendlines found, with and
without a minimum length setting. |
|
|
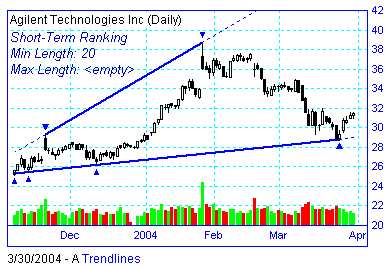
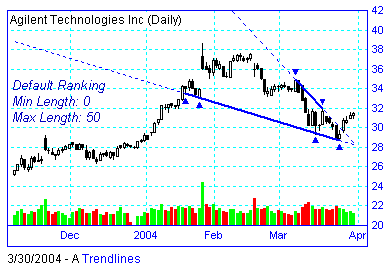
Maximum Length
specifies the maximum length the trendline can
be. You specify whether to use this parameter by checking or unchecking the checkbox next to the parameter value box. If you
don't use this setting, then TCScan+ will find the best trendline it can, allowing it
to be as long as the amount of data you have on the chart. This
parameter is useful if you want shorter-term trendlines, but also want to
see longer term price data. For example the two charts below show
the trendlines found with and without a Maximum Length setting of 50 bars.
|
|
|
Min
Touches specifies the minimum number of touches to the trendline.
Generally, trendlines that are touched more, are more reliable. |
|
|
Alert Proximity%
specifies how close the current price must come to
the trendline, in percent, for you to be alerted of that
fact. For example, if today's price
is 48.0 and the value of the trendline for today is
50.0, then the percentage distance between the two is
4%. If you had your 'Alert Proximity %Dist' value set at 5,
then you would be alerted to this proximity, because 4
is less than 5. If you want to ignore this setting then leave the
box empty. |
|
|
Log Scale
checking this box will cause TCScan+ to use Logarithmic Scaling (instead
of the normal Arithmetic Scaling) for trendline construction
and charts. When using logarithmic scaling you will notice
that the price axis numbers on the chart do not increase linearly,
but rather proportionally. |
|
|
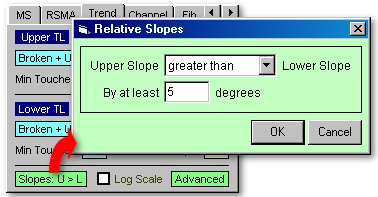
Slopes clicking this label allows you to specify
the relation between the slopes of the upper and lower trendlines.
This is useful in finding chart patterns. For example to find
symmetrical triangles, you would want the slopes of the upper and lower
trendlines to be opposite. If you wanted to find flags or channels,
you would want the slopes to be equal (parallel.) |
Clicking the button marked "Advanced Settings" on the trendline tab brings up
the Advanced Settings Form, which allows you to fine tune your trendline scan,
and choose how to display the trendlines. Shown below is a copy of the
trendline form - click on the various parameter descriptions to get further
help. ![]()
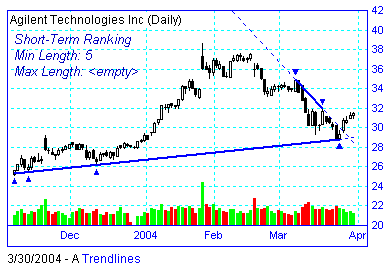
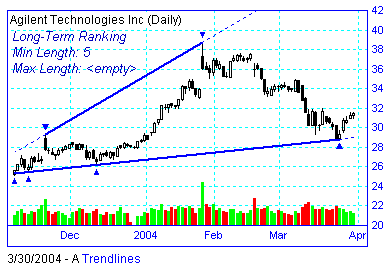
The trendline ranking settings are particularly useful in fine-tuning the types of trendlines to find. For example, the two charts below show the lines found using either the "Short Term" or "Long Term" example settings, with all other parameters the same.
A number of example settings files are included in the TCScan+ directory. You can access them by pressing the F11 key from TCScan+ (or using File > Load Scan Settings.)
For short-term trades, we recommend setting the Minimum Length to 0, Maximum Length to 20, and using the example Short Term Ranking settings. For longer-term trades you can use a Minimum Length of 20, a Maximum Length of 100 (or don't specify a Maximum Length at all) and use the example Long Term Ranking settings. These settings files are stored in your TCScan+ directory under the names 'Short Term Trendlines' and 'Long Term Trendlines'. You can load them using the Load Scan Settings Command. The charts below show the lines produced for the same data set using the two different settings.
Remember that with all trades, you should have a very clear idea of where your stop is before you execute the trade - we have seen cases where there is a good break up through an upper trendline, lasting for a few days, followed by a dramatic breakdown all the way through the lower trendline. If you held onto your initial long position taken after the up break you could lose big-time. Instead, always be ready to go the other way if the market tells you to do so - and use stops!
To get a feeling for how the parameters affect trendline
construction, we suggest you create a list in TeleChart with 5
to 10 stocks, and run the Trendline scan with different
parameters. When doing so, set the Alert Proximity% parameter to 1000
(to display all items in your list with valid
trendlines, now matter how far the current price is from those
trendlines.) You can then experiment see how parameter
changes affect the trendlines drawn. Here are a few more examples showing
the same chart with different settings: ![]()
The column headed 'Name' lists the
names of the items that passed your filter criteria,
and are near the upper or lower trendline. The column
headed 'UTL' contains the
current position of the upper trendline, while the one
headed 'LTL' contains the current position of the lower
trendline. You could also get these numbers by running your cursor
over the chart for the scanned item. PTrnd and VTrnd show the price and
volume trend slopes respectively. ![]()