Examples Parameter Description Typical Settings Results Table
Channels are similar to trendlines,
but whereas upper and lower trendlines can be at any
angle to each other, the upper and lower channel lines are parallel to each
other. The Trendline
scan will find channels as part of its larger scan, but if
you want to scan for Channels only, for example if you are
interested in rolling stocks or options, then you can use
the Channel scan instead. Click Here for some Channel scan
examples. ![]()
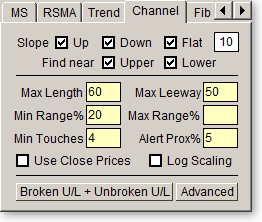
The Channel Tab allows you to set the parameters for your Channel scan. You can specify whether to find upward, downward or horizontal sloping channels, and set parameters such as the maximum length of the channel, how many touches to the channel lines must have occurred in the past and how wide the channel can be.

Channel lines are constructed differently from trendlines, so the parameters have a slightly different meaning than those described in the trendline section. Channels are created by drawing a straight line that best fits all the data for the past number of bars defined by the Length and Leeway Values (see below.) Upper and lower channel lines are then created above and below this center line. The distance of the channel line from the center line is set by the maximum distance between the center line and price over the length of the channel. The price considered is either the High and Low, or the Close only, depending on the option you have set on the Parameters page.
|
|
Slope Up/Down/Flat
Checking either of these boxes will cause TCScan+ to search for
upwards, downwards and/or sideways sloping channels. You must check at
least one of these three checkboxes for the scan to run. The
textbox to the right of the 'Flat' checkbox is the sensitivity (0 to 90)
used in determining if a line is flat. A value of '0' will cause
only perfectly flat lines to be found, but when searching for flat lines,
you should rather allow some degree of tolerance, e.g., 5-10 to allow for
lines that are almost flat. This setting is also
applicable to the 'Up' and 'Down' sloping checkboxes too. For
example, if you
enter a value of '20' and then select only the 'Up' checkbox, only steeper
up-sloping lines will be found (because lower-sloping ones will be
considered flat.) |
|
|
Find near Upper/Lower Check one (or
both) of these two boxes to select whether price must be near the upper or
lower channel lines. |
|
|
Max Length
is the maximum number of bars used to construct the
channel. |
|
|
Max Leeway
allows TCScan+ to find the best-fitting
channel within the period specified by your Max Length and Max Leeway
settings. The channel length is adjusted on the left
side by up to the leeway amount and the length that provides the best
channel is used. The channel is also adjusted on the right hand
side, but in that case by the amount specified on the broken/unbroken
form, and only if you have allowed broken lines (see below.) So, as
an example, if
you have a Max Length of 60, a Max Leeway of
20, and a broken days setting of 5, it is possible to have a channel created that is
only 35 bars long. Note that the length
of the channel drawn on the Chart
will always be equal to the value in Length,
though it may not be based on all the data over which
the channel is drawn, because of the Leeway
parameter. The actual data used to determine the
channel will be highlighted by the channel lines drawn
thicker in that region. An example is shown below. Both are for a
100 day lookback period and 80 day channel, but the left one was run with
a 60 day leeway, while the right was run with no leeway. |
|
|
Min Range% and
Max Range% specify the minimum and maximum range of the channel as a
percentage of the average price along the channel. For example, if
the top of the channel is at 120 and the bottom is at 105, then the range
is 15. If the average price along the channel is 110, then the
percentage range is 15/110 = 13.6%. If you had a Min Range
setting below this value, and a Max Range setting above it, then the channel would
pass your scan (depending on other settings too.) These settings are
useful for making sure that very narrow or wide channels are not found. An example of its use can be found in the
example settings file for 'Rolling Stocks' included in the TCScan+
directory. Press F11 from TCScan+ to open it. |
|
|
Min
Touches specifies the minimum
number of touches to the channel lines. This number is the total for both the upper and lower
channel lines. Generally the more touches, the more significant
a channel, so settings a higher Min Touches value should
find better channels. |
|
|
Alert Proximity %
specifies how close the current price must come to
the upper or lower channel line for you to be alerted
of that fact. The calculation method is the same
as that described above. For example, if today's
price is 48.0 and the value of the upper channel line
for today is 50.0, then the percentage distance
between the two is 4%. If you had your 'Alert Proximity %' value set at 5, then you would be alerted to
this proximity, because 4 is less than 5. If you want to ignore this
setting then leave the box empty. |
|
|
Use
Close Prices will cause the channels to be calculated based on the
close price of each bar, rather than the high or low. |
|
|
Log Scaling
checking this box will cause TCScan+ to use Logarithmic Scaling (instead
of the normal Arithmetic Scaling) for channel construction
and charts. When using logarithmic scaling you will notice
that the price axis numbers on the chart do not increase linearly,
but rather proportionally. |
|
|
Broken/Unbroken
clicking this button will open a form allowing you to specify whether the
upper and lower channel lines can be broken or unbroken, and if broken,
when they are allowed to have been broken. The length of the period
over which the channels are allowed to have been broken is used as the
right-hand side leeway for the channels. See the two examples below,
which show the same stock with different broken/unbroken settings. |
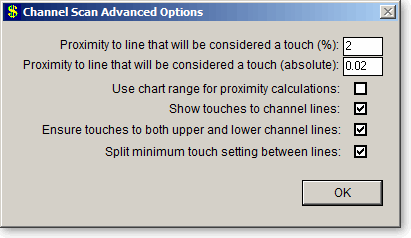
Clicking the button marked Advanced will bring up a form allowing you to specify advanced options.

|
|
Proximity to line that will be
considered a touch (%) specifies how close the price must come to the
upper or lower channel line for the price to be
considered a touch, measured as a percentage of the
price. For example, if at a particular point the
upper channel line value is 50.0 and the price is
49.75, then the percentage distance between the price
and upper channel line is 0.5%. If 'Touch Prox%' is set at 1 then
this point would be considered a touch to the channel, because 0.5% is
less than the 1.0 Touch Proximity Percentage. |
|
|
Proximity to line that will be
considered a touch (absolute) is identical in concept to 'Touch
Prox%' described above, but in this case the proximity is measured in
absolute terms rather than in percent. It is useful to have a touch
defined in terms of both percentage and absolute value. As an
example: for a $100 stock, a 1% Touch Proximity would be ±$1, but for a $1
stock that would translate to ±$0.01, which is a very tight tolerance.
Therefore to handle low value stocks you could enter the minimum tick
value into the Absolute Proximity. |
|
|
Use chart range for proximity calculations will
use the chart range as reference for proximity calculations, otherwise
the channel line will be used as reference. |
|
|
Show touches to channel lines will select
whether to have small arrows shown on the chart where price touches the
channel lines. Examples can be seen in charts above. |
|
|
Ensure touches to both upper and lower channel
lines will only allow channels that have touches to both channel
lines. Because TCScan+ finds the best channel by first finding the
best center line through the past data and then works out how to place the
channels around it, it is possible that one line could end up without any
touches to it. An alternate method is therefore available, which
will ensure touches to both lines. An example of the same chart with
the two different options applied is shown below. |
The channel length is usually set in proportion to the lookback period and a large leeway is specified, typically in the 80-90% range. For example, with a 100 day lookback, we would set the channel length at around 80 to 90 days and the maximum leeway around 60 to 70 days. The Length value is not as important as the fact that we prefer to make the Leeway a high proportion of the Length. For example, if we were trying to find channels of length 20, we would make the Leeway value between 10 and 15. Setting the Leeway high gives TCScan+ maximum ability to find a good-fitting channel. Note that we prefer to set a higher minimum Number of Touches for the Channel Scan than the Trendline Scan, because the number of touches in this case applies to both the upper and lower channel lines. A setting of 4 here means that there should be at least four touches to the channel lines, which could mean 3 touches to the top and 1 to the bottom, or 2 to the top and 2 to the bottom, or none to the top and 4 to the bottom, etc. However, to prevent the latter case, we leave the Ensure touches to both upper and lower channel lines and Split minimum touch setting between lines advanced options checked.
As with the Trendline Scan, we suggest you create a list in TeleChart with 5 to 10 stocks, and run the Channel scan with different Length and Leeway values to get a feel for how these parameters affect channel construction. Leave the Alert Proximity % parameter empty during these tests to display all items in your list with valid channels, no matter how far they currently are from the channel lines.
As
described above, you can press the F11 key from TCScan+ to load one of the
example settings files, for example ‘Bullish
- CH - Rolling Stock at Support' and ‘Bullish - CH - Channel Break Out’. ![]()
The column headed 'Name' lists the
names of the item that passed your filter criteria,
and are near the upper or lower channel line. The
column headed 'UCH'
contains the current position of the upper channel line,
while the one headed 'LCL' contains the current position of
the lower channel line. You could also get these
numbers by running
your cursor over the chart for the scanned item. ![]()