Trendline Scan Examples
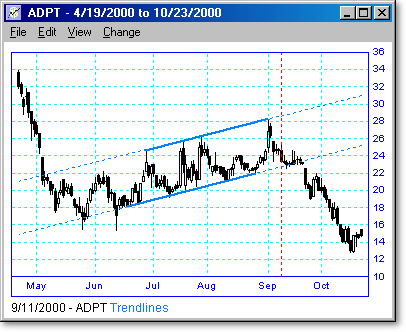
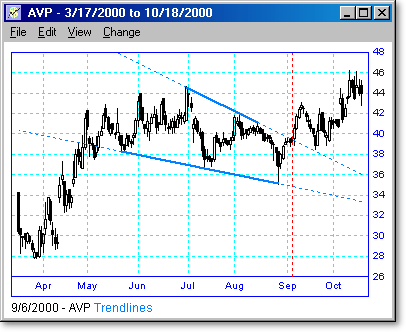
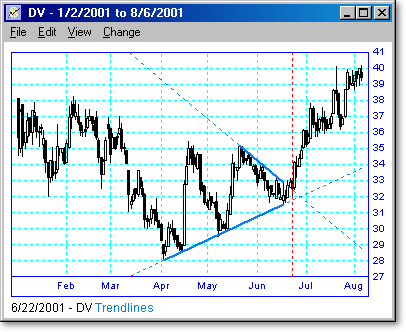
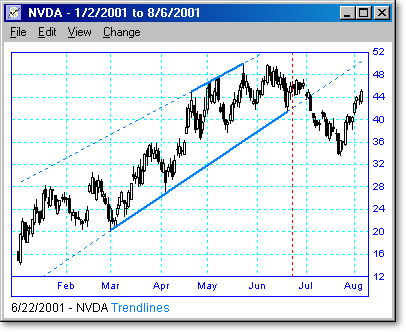
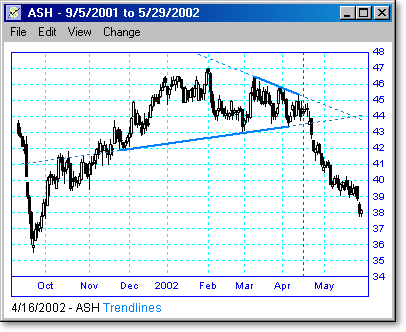
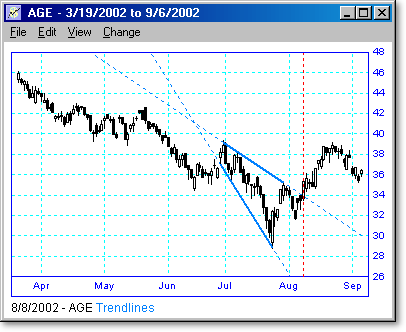
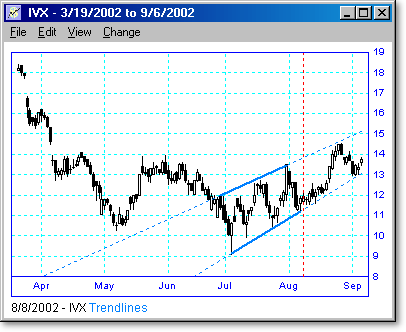
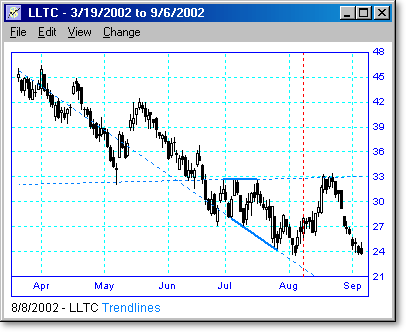
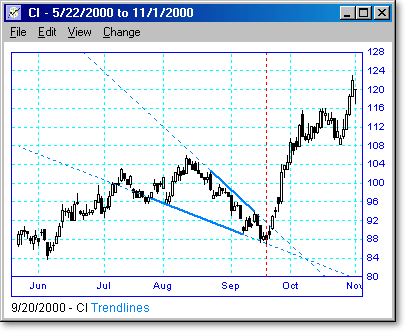
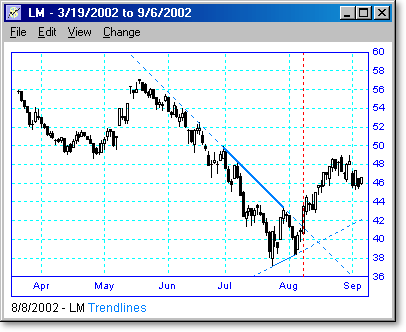
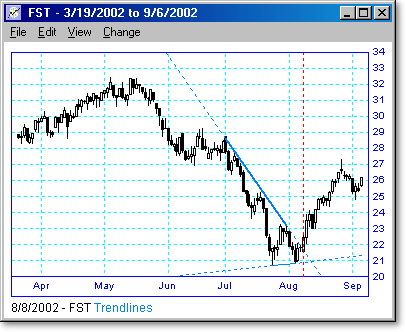
Following are some examples of trendline scans with different lengths and periods. The vertical dotted line shows the day the scan was run, and the points to the right of the line show what happened when the trendline was broken or touched. We believe that trendline breakouts are one of the highest probability trades there are.
