![]()
|
|
|
|
TCScan+'s Charts allow you to graphically review the items passing your filter criteria. You can specify preferences to have charts displayed during the scan, after the scan is complete and also whether to open the charts in TeleChart at the same time. The chart will automatically display items relating to the scan type you are running and you can also draw additional objects on it, which will be retained until you delete them. Various actions can be executed by selecting items from the main or right-click menus, and by using shortcut keys or the toolbar buttons. (Click on the toolbar icons below to be directed to further help.)
The toolbar buttons and shortcut keys will allow you to navigate through your stock's data on the chart. The behavior of the navigation buttons is different from what you may be used to from other charting programs. When you click one of the buttons, TCScan+ will actually change the appropriate parameter (e.g. lookback period) on the main TCScan+ form, then rerun your current scan using the new parameters. However, it runs the new scan with your general filter settings ignored. It does this because it is likely that as you, for example, move back in time, your current filter settings, like number touches to a line, will not be met - and so a line would not be found. Because of this behavior you will notice that while you are navigating on the chart, the other items in your results list will be grayed out to indicate the new settings shown on the main form do not apply to them. When you move to a new item in your results list or click within the results list, the settings you had before the chart navigation began will be restored. Another consequence of the way TCScan+ reruns the scan with each navigation change, is that chart navigation may not be as quick as you might expect, especially with certain scans like the CandleStick one in Editable Patterns mode. If this is a problem use the modifier keys (Shift, Ctrl and both Ctrl and Shift) to increase the step size taken between changes.
|
|
Time
Frame You can change the chart time frame by
clicking on one of the three 'T' buttons on the toolbar. |
|
|
Panning
(Left/Right) Clicking one of the left/right arrow toolbar buttons
will move the chart left or right by one bar. If you hold the Shift
key down while clicking, the movement will change by 5 bars instead of
1. Using Ctrl will change by 25 bars and using both Ctrl and Shift
will change by 50 bars. These buttons will actually be changing the shift
value on the main form. If you keep the button pressed down, the
chart will scroll until the button is released, or until the new
conditions cause the stock to fail your scan criteria (see the
introduction to Navigation above.) The actions of these buttons can
be duplicated using the left and right arrow keys on your keyboard
(including the Shift/Ctrl modifiers to speed up movement.) You can also
click the S key to bring up a dialog box allowing you to enter the exact
number of shift bars required. When using a shift value greater than 0,
you can choose whether to display bars to the right of the scan date,
i.e., bars within the shift period, by selecting 'Shift Bars Visible' from
the Change menu. A vertical red dotted line will be drawn to
indicate where the shift period starts. |
|
|
Number
Bars on Chart Clicking |
|
|
Price
Scaling Clicking |
|
|
Revert
After you have used the above buttons to scroll through the chart data,
you can revert to the way the chart initially appeared before you did any
time frame, bar count, etc. changes to it by clicking the |
Chart Operations
![]()
|
|
Saving
Charts Charts can be saved in various file formats by
clicking |
|
|
Printing
Charts Pressing the P
key or clicking |
|
|
Zooming Clicking |
|
|
CrossHair Cursor Clicking the |
Chart Properties
![]()
|
|
Changing
Colors You can change most of the colors used on the chart
by pressing the C key,
selecting Change Colors on the right-click menu or pressing the
toolbar button |
Select a new color by clicking on the applicable color swatch. Click Apply to apply the new colors to the chart without closing the form. Click OK to apply the colors and close the form, or click Cancel to close the form without saving any color changes. Click Defaults to return all colors for the specific scan type to their default first-install values.
|
|
Chart
Size You can increase or decrease the size by
dragging the border of the Chart, by pressing the Page Up or Page
Down key, or by selecting from the View menu. You can
make the currently-displayed chart size the default by selecting Save
Current Chart Size as default on the right-click or File
menus. You can return a chart to its current default size by selecting Return
Chart to Default Size from the Right-Click or View menus.
You can also return it to its first-install default size using File >
Return default size to install setting. |
|
|
Chart Margins
You can adjust the amount of extra space added to the top, bottom and
right margins by selecting the appropriate item from the Change
menu or under Change on the Right-Click menu. The changes you
make will apply to all future-drawn charts, until you change them
again. You can also use the left and right arrow keys to adjust the
right margin, the up and down keys to adjust the bottom margin, and the up
and down arrow keys along with the Ctrl key to adjust
the top margin. You can hold the Shift key down along with
the above combinations to get larger increases in the changes made.
Note that the chart margins might not always move when you change the
setting or press the arrow keys. This is a result of how the axes
are scaled and numbered - just repeat the action until movement occurs. |
|
|
Price
Bars You can click the |
|
|
Information
The item name and date range is shown on the title bar when the chart
is opened or the item is changed. Moving the mouse cursor over
the chart will change the caption to show the date, value and
Open/High/Low/Close at the mouse cursor position on the chart.
Summary information is also printed at the bottom of the chart. When
drawing lines, the caption bar will change to include the change in price
(dP), change in bars (Bays) and Strength of the move covered by the
line. The Strength is calculated as the square of the change in
Price divided by the number of Bays covered by the move. It is an
indication of the strength of a move and was developed and described by
Alex Saitta in the October 2000 issue of Technical Analysis of Stocks
and Commodities Magazine. The idea is that as succeeding up or
down moves lose Strength then a major reverse move is likely. |
|
|
Scan
Details You can click the |
User-drawn Objects (Lines, Circles, Fib Levels, Fib Spirals)
![]()
|
|
Copying
Program Objects Program-drawn objects can be copied as
user-drawn objects by pressing the W key or selecting Copy program objects
from the Edit menu. For example, if you have run a trendline
scan, you can press W on the chart and the trendlines found by the program
will be copied onto your chart, so when you do another scan type they will
still be there. |
|
|
|
|
|
Selecting
Objects User-drawn objects can be selected by clicking on
them. Once an object is selected, it will have small squares
called anchors shown on it. These anchors can be moved to move the
start and end points of the object, or the object can be dragged as a whole
by clicking and dragging between the anchor points. Note that to select
Fibonacci Spirals you need to click on the pivot line used to create the
Spirals. You can switch from one selected object to the next by
pressing the N key. |
|
|
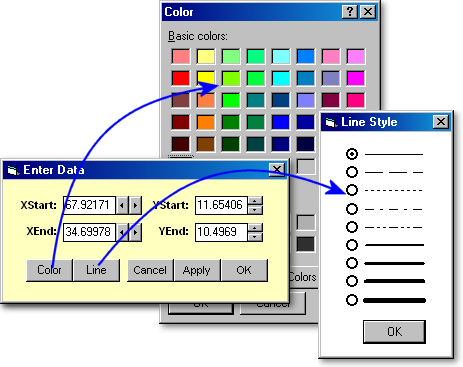
Adjusting and Modifying Objects Once you have selected an object, you can move its anchor points by clicking on them and dragging. You can also open a form to edit the object's settings by double-clicking on the object, clicking Modify Selected Object in the Edit Menu, pressing the A key while the chart is selected or selecting from the Right-Click menu. This form will allow you to exactly specify the object's end-points by entering their values or by clicking on the arrow buttons to the right of the text boxes (see picture below.) Holding down the Ctrl key while clicking will allow fine adjustment and holding down the Shift key while clicking will allow coarse adjustment.
This form also allows you to change the colors and line settings of user-drawn objects.
For User-drawn Fibonacci Levels, this form allows you to choose whether to
display the pivot lines, whether to place the level values on the left,
middle or
right of the level lines and the ability to invert the fib levels, i.e.,
swap the start and end points of your pivot line. You can also
independently specify line types for the pivot and fib lines. For trendlines,
you can specify whether the line should extend across the chart and the
line styles for both the main and extended lines.
|
|
|
Deleting
Objects Once you have selected an object, you can delete it by
pressing the Delete key, or by selecting Delete Selected Object
from the Edit menu, or by selecting Delete under Selected Object
on the Right-Click menu. You can also delete all objects of a
certain kind, or delete completely all objects by selecting the
appropriate item under the Edit menu. Finally, you can delete
the last-drawn object without entering Selection Mode, by pressing the
delete key in combination with the key used to draw the object. So
for lines, just press the Delete key, for Circles press Alt
and the Delete key, for Fibonacci levels press Ctrl and
the Delete key. and for Fibonacci spirals, press the Ctrl, Shift and
Delete keys |
|
|
Saving Objects
A collection of user-drawn objects can be saved by selecting Save chart
objects from the File or Right-Click menu, or by pressing the V
key. You can then load these objects using Load chart object file
from the same menus or by pressing the L key. |
|
|
Duplicating
Objects You can duplicate the currently-selected object by
select Duplicate Selected Object from the Edit or
Right-Click menus, or by pressing Ctrl-C. |
|
|
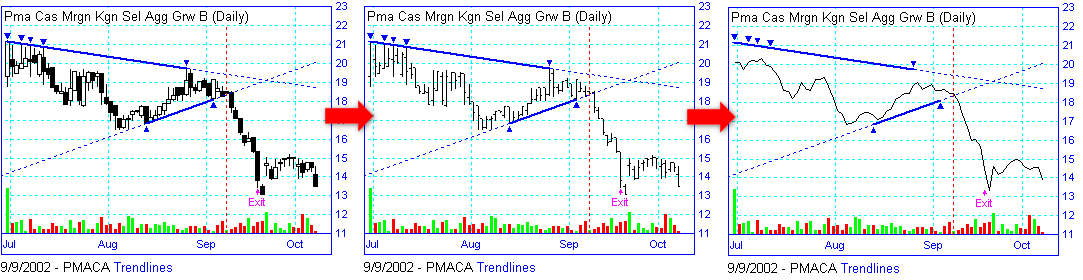
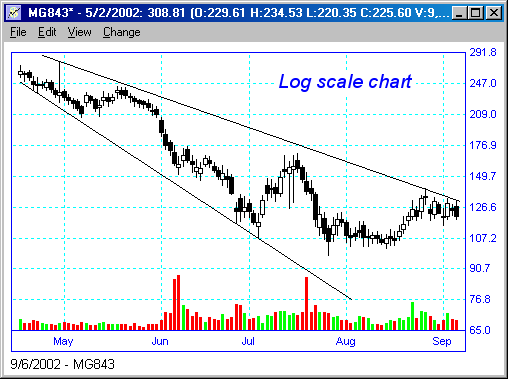
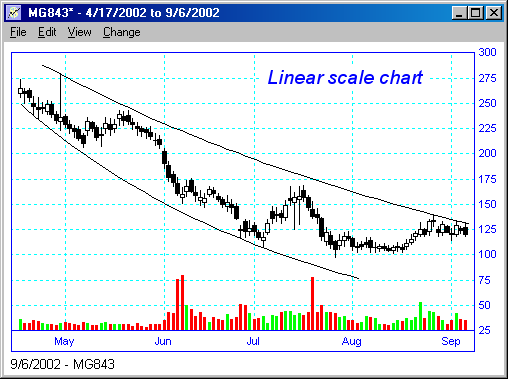
Scaling Conversion User-drawn lines first drawn on a chart with linear (arithmetic) scaling, will be correctly redrawn when displayed on a chart with logarithmic scaling and vice versa. This prevents confusion when switching from one scaling type to another. For example, the first chart below shows two trendlines drawn on a chart with logarithmic scaling, and the second chart shows the same lines displayed on a chart with arithmetic scaling. |