Examples Parameter Description Typical Settings Results Table
We have found Worden's MoneyStream indicator to be an extremely useful indication of accumulation or distribution of an item. Of particular usefulness are divergences between MoneyStream and Price. If the MoneyStream starts climbing and the price stays flat, or if the price starts falling and MoneyStream does not, it is a good probability that there will be a price climb in the near future. The reverse hold true as well - if price climbs strongly, but MoneyStream does not follow, then there is likely to be a price collapse soon after. Click Here for some examples.
Details on MoneyStream are found in the TeleChart user manual, and video training courses are also available through the TeleChart Website. TCScan+ will help you implement the strategies you learn from these sources, as they can not be fully-automated in the current version of TeleChart.
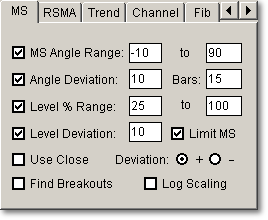
The
MoneyStream Tab allows you to set the parameters for your MoneyStream
scan. You can check boxes to select whether to scan for MoneyStream
Angles, Levels, and divergences in Angles and Levels. You can then set the
limits for these parameters. ![]()

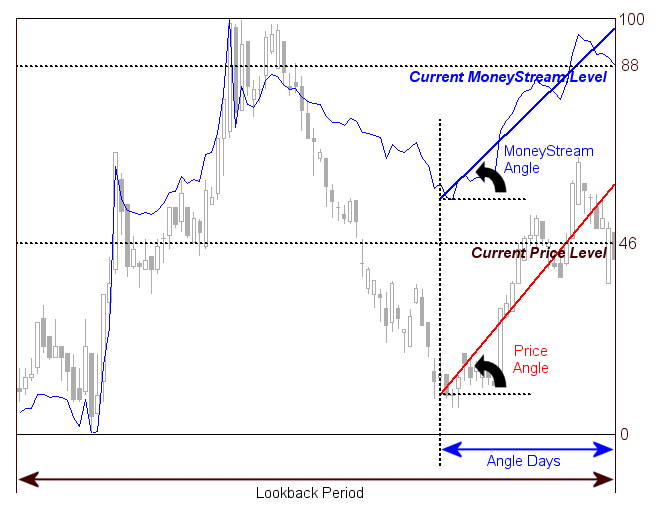
The figure below illustrates the meaning of the various MoneyStream Scan parameters - a description is provided below.

TCScan+ helps you find two types of divergences: (You can search for either or both at the same time.)
Level Divergences: Is the MoneyStream at a higher historical level than price at this point in time, or vice-versa?
Angle Divergences: Is the MoneyStream rising faster or slower than Price at this point in time?
For Level Divergences, TCScan+ searches back over the Lookback Period you specify and determines the highest and lowest value for MoneyStream and Price. The Low and High are then assigned values of 0 and 100, and the values in between are scaled accordingly. Therefore, if you run a scan for MoneyStream levels from 50 to 100, you are specifying that the current MoneyStream level must fall in the top 50% of the range of MoneyStream values over the lookback period. The difference between the levels of MoneyStream and Price is the Level Deviation. For example, in the graph above, the latest MoneyStream value is at 88% of the lookback range, while the price is at 46% of the lookback range, so the level deviation is 88 - 46 = 42. This is a positive deviation because the MoneyStream level is higher than the Price level.
For Angle Divergences, The MoneyStream and Price angles are calculated over the previous number of bars you specify in the box next to Angle Deviation. Upward sloping lines have an angle from 0 to 90 (straight up), and downward sloping lines have an angle between 0 and -90 (straight down.)
You can search for MoneyStream angles within a range and for deviations between the MoneyStream and Price angles. If the MoneyStream Angle is higher (more counter-clockwise) than the Price Angle then there is a positive angle deviation, and if the reverse is true, then there is a negative angle deviation.
To summarize, the parameters you can set are as follows:
Depending
on the options you check on the MoneyStream tab, the results table will have
between 1 and 5 columns. The column headed 'Name' lists the names of the items
that passed your filter criteria. The column headed 'Level' is
the MoneyStream level, 'L Dev' is the difference in levels between the
MoneyStream and Price, 'Angle' is the MoneyStream Angle, and 'A Dev' is the
difference between the MoneyStream and Price Angles. Note that the values
in 'L Dev' and 'A Dev' will be positive numbers unless you have the Ignore
Filter option set. Their type of deviation is given by whether you
selected the Positive or Negative option buttons. When you
have the Ignore Filter option set, then the Positive and Negative
option buttons are ignored, and the 'L Dev' and 'A Dev' values will be shown as
positive or negative, indicating positive or negative deviation. PTrnd and
VTrnd show the price and volume trend slopes respectively. ![]()