Examples Parameter Description Typical Settings Results Table
Fibonacci levels are an extremely useful way of predicting turning points for your items - it is almost uncanny to see how accurate they often are. Many traders use them religiously, including the well-known Tom DeMark, and they are an important part of the Elliott Wave Theory - in fact we and others believe them to be the most usable and reliable part of Elliott Wave Theory. A good starting point for learning about Fibonacci levels in trading is Robert Fischer's books Fibonacci Applications and Strategies for Traders and The New Fibonacci Trader: Tools and Strategies for Trading Success.
Fibonacci levels are determined by applying Fibonacci ratios to pivot lines.
|
|
Fibonacci Numbers A series of numbers first studied by an Italian mathematician, Leonardo Pisano, but nicknamed Fibonacci, around 1200. They are determined by starting with zero and one, and then adding the preceding two numbers to determine the next number in the series. So, 0+1=1 is the next number followed by 1+1=2, then 1+2=3, then 2+3=5, then 3+5=8, then 8+5=13, and so on, leading to the series 0, 1, 1, 2, 3, 5, 8, 13, 21, 34, 55, 89, 144, etc. |
|
|
Fibonacci Ratios An interesting feature of the Fibonacci numbers is that as the numbers in the series get larger, the ratio of one number divided by the previous number approaches a constant value of 1.618, and the ratio of one number divided by the next approaches a constant value of 0.618. (Actually theses numbers are never-ending, like Pi, but are shortened to 1.618 and 0.618 for simplicity) These are the only numbers whose inverse is equal to itself plus or minus one (1/1.618=1.618-1=0.618 and 1/0.618=0.618+1=1.618) Other ratios are also important in trading, for example 0.382 (1-0.618), 2.618 (1/0.382), and 4.236 (1 / 0.618×0.382) |
|
|
Pivot Lines are lines drawn from a recent high to a recent low, or vice-versa. |
Fibonacci numbers and ratios are found throughout nature, for example in the structure of snail shells, the layout of sunflower seeds, leaves and petal arrangements, and even in the proportions of the pyramids. It is not surprising that they are therefore also found in the charts of items. An interesting website devoted to the Fibonacci numbers may be found here.
Two types of Fibonacci levels are typically found: Price Levels and Time Levels - TCScan+ will allow you to find both.
Price Levels
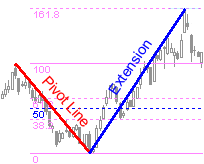
The Fibonacci Ratios are applied to the height of the last pivot line, and the resultant values are added to the end of the pivot line, as shown by the horizontal cyan lines below - the price fails at the 161.8 extension (blue line) of the previous pivot (red line.)
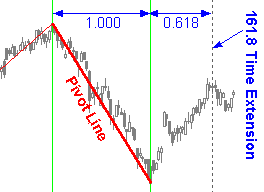
The Fibonacci Ratios are applied to the width of the last pivot line and the resultant values are added to the end of the pivot line, as shown below.
Many of the levels are important, but we have found the 161.8 and 261.8 levels to be most reliable. Also important are the 0 and 100 levels in Price Level scans, as support and resistance, respectively, even though these are not strictly Fibonacci Ratios. TCScan+ will work out a series of Fibonacci levels for all the items in your list, and will alert you when an item is near to one of its Fibonacci Levels. The issue of when to trade on Fibonacci Level touches is a complex one and we strongly recommend you obtain Robert Fischer's Fibonacci Applications and Strategies for Traders to help you in your trading decisions. Click Here for some examples of Fib Level Scans.
Note that you can also draw your own
Fibonacci Price level lines on any Chart. ![]()
Fibonacci Level Scan Parameters
|
|
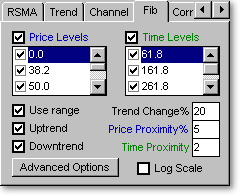
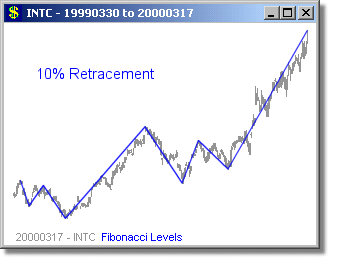
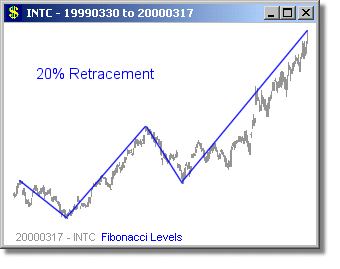
Trend Change is used to determine the pivot lines for your items. It specifies by what percentage an item must retrace before the previous turning point is considered a pivot. The lower the percentage, the more numerous and shorter the pivot lines will be and vice-versa. For example see the charts below with pivot lines based on 10% and 20% trend changes respectively. |
|
|
Use Range Checking this box will cause TCScan+ to use the range (highest high minus the lowest low) of the data in the lookback period as the denominator for the percentage in Minimum % for Trend Change, instead of the absolute price. This option tends to provide more uniform pivot lines - you should experiment with using or not using this option on a few items to see which you prefer. |
|
|
UpTrend/Downtrend allows you to specify whether the price trend since the last pivot line should be up or down. |
|
|
Price/Time Proximity % specifies how close the price must be to a Fibonacci level, in percent, for you to be alerted. If you want to ignore these settings then leave the boxes empty - this would cause the results to show no matter how far the current price is from the level. |
|
|
Levels You can check some or all of the checkboxes in the list of levels to find touches to those Fibonacci levels. An easy way to select is to move up and down the list with the arrow keys, then press the space bar to change the selection. Note that the levels in the list can be changed, added to and deleted to by right-clicking any level within the list. |
|
|
Log Scaling
checking this box will cause TCScan+ to use Logarithmic Scaling (instead
of the normal Arithmetic Scaling) for Fibonacci level construction
and charts. When using logarithmic scaling you will notice
that the price axis numbers on the chart do not increase linearly,
but rather proportionally. Note that using logarithmic scaling
for Fib level construction is not common, or necessarily correct,
however, we have found it useful and valid when looking at longer
time frames. |
|
|
Advanced Options Clicking the Advanced Options button will bring up a form containing additional settings for the scan. In particular you can specify whether any levels found must be intact or not, i.e., they must not have been crossed by price since the last pivot line. A sensitivity parameter is included to help specify what would constitute a break. A value of '0' would mean absolutely no break allowed, whereas a higher value would allow a small break to occur. |
Some example settings files are included in the
TCScan+ directory. Press the F11 key in TCScan+ to open them (or use File
> Load Scan Settings.) For long term levels, use a high Trend Change%
value, like 40, and specify a longer lookback period, like 250. For
shorter term levels use a shorter lookback period (100) and a smaller Trend
Change% (20). In both cases, have the 'Use Range' box selected. For
Price Levels, we
typically only look for touches near the levels 0, 100,
161.8 and 261.8 - though 361.8 and 423.6 are sometimes also
useful. For Time Levels, the 61.8 level is most important, followed by
161.8 and 261.8. You can also experiment by changing the Time Level
numbers (see above) to other numbers, such as
50,100,150,200, etc. to look for cyclic behavior in stocks. These settings
would find prices near half and full cycle lengths from the last turning point. ![]()
The column headed 'Name' lists the
names of the items that passed your filter
criteria. The column headed 'P Lvl' contains the
Fibonacci Price level that the current price is closest to, and
the column headed 'P Val' is the actual value of that
level. The column 'T Lvl' lists the closest Time Level and the column 'T
Val' lists how many bars the current price is before (negative numbers) or after
(positive numbers) the Time Level. PTrnd and VTrnd show the price and
volume trend slopes respectively. ![]()