Volatility Stop Scan Examples
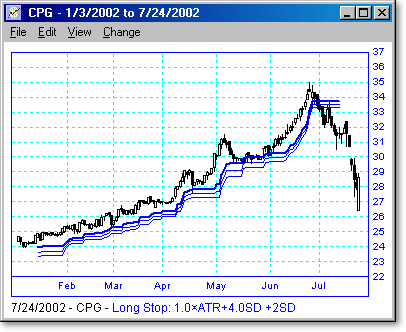
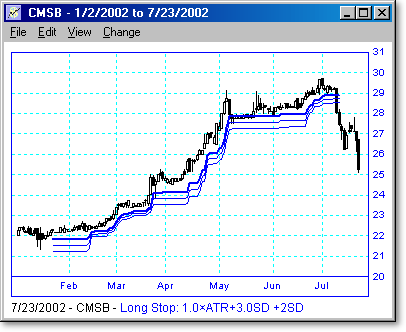
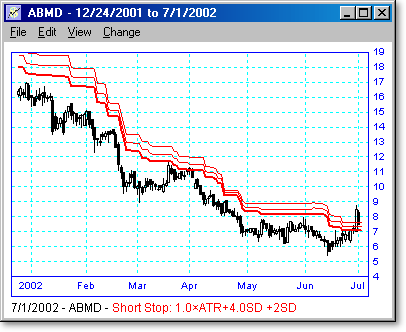
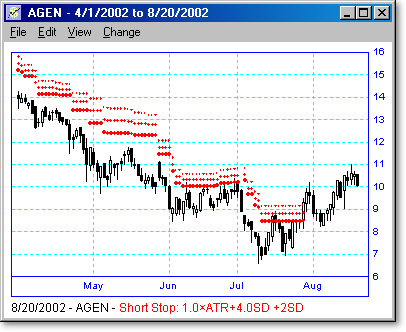
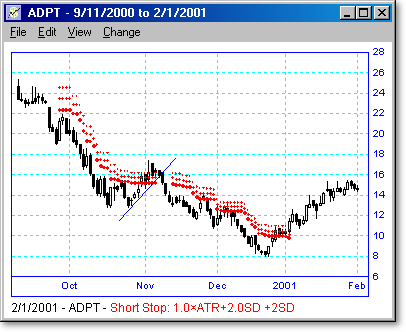
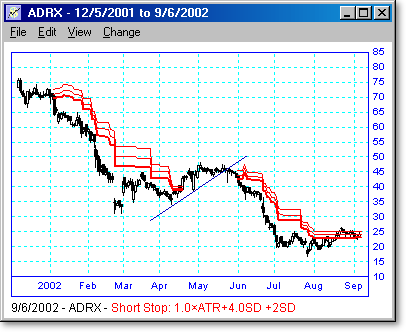
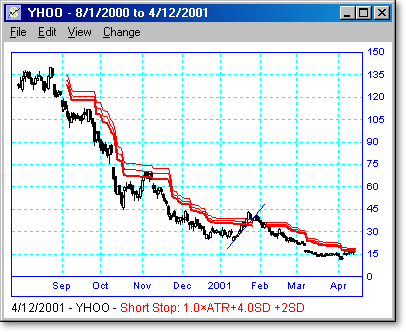
Following are some examples of Volatility Stop scans with different time periods and degrees of Stop Tightness.
Long Position Stops
|
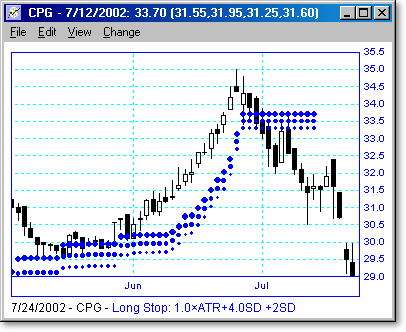
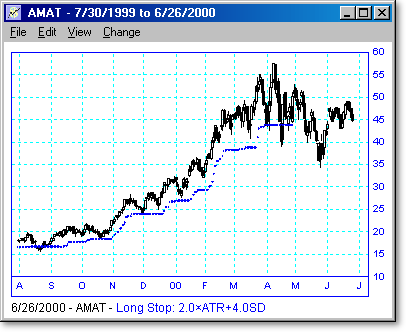
Shown below is a close up of the latter part of the chart above, to illustrate the 3-tier stop system. |
|
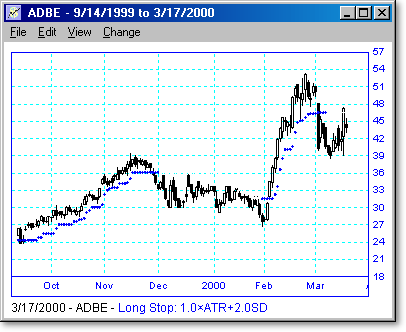
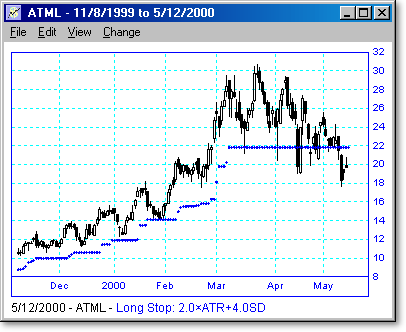
The next three charts show how it is sometimes advantageous to tighten your stops when the security becomes overextended. The first chart shows a long-term stop in place. |
|
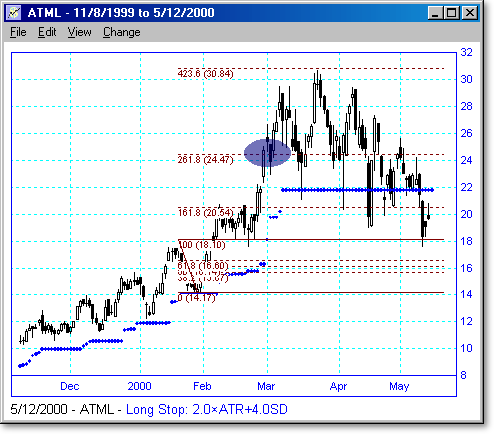
The next chart includes Fibonacci levels and shows that the security is already overextended at the position of the Blue Ellipse. At that point it would be prudent to tighten your stops. |
|
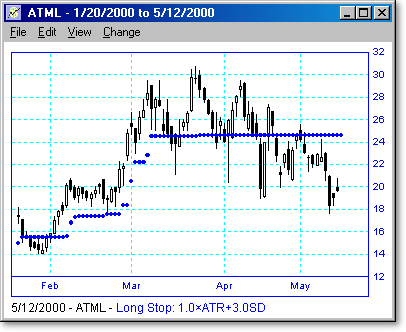
The next chart shows an enlargement of the period from 2/2000 to 5/2000, but with a tighter stop. As you can see, we preserve a greater amount of profit by tightening our stops when our technical analysis tells us to do so. |
Short Position Stops
Home Video Download Purchase Help
© 2012 Rijker LLC