Support & Resistance Level Scan Examples
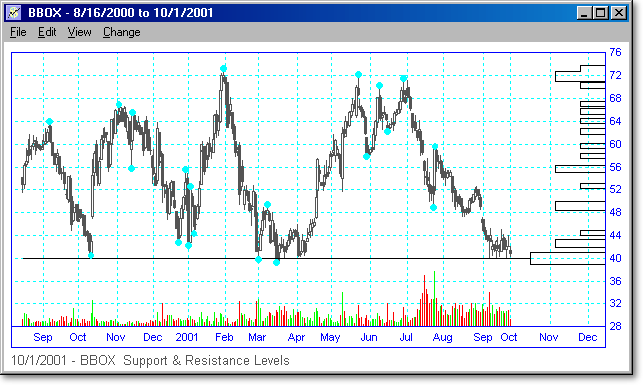
Price-based support and resistance levels are found by searching through the stock data and locating all the points where price has changed trend previously. These pivot points become high-probability locations where price will turn again. TCScan+ sums the number of past pivot points and displays the count at each price level in the form of horizontal bars on the right of the chart - an example is shown below. The wider (left-right) the bar, the more past turning points there have been within the range of that bar. In the chart for BBOX below, you can clearly see the strong support around 40 for this stock, along with less-significant levels. In the two months following this scan date, the stock climbed up to around 57 again.

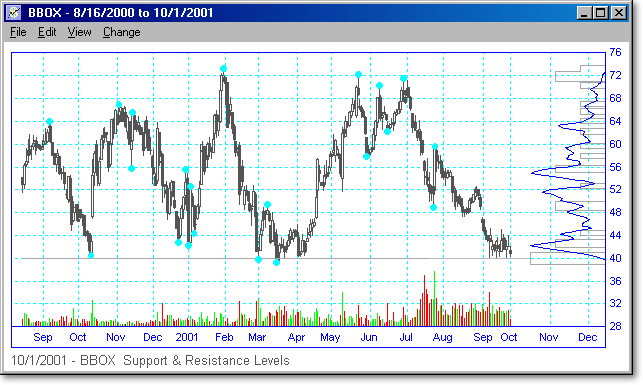
Volume-based support and resistance levels are found by summing the daily volume at each price level to create a cumulative curve of past volume activity at each price. You can therefore see at which price levels there has been a lot of trading activity. As with the price level boxes, this curve is plotted on the right of the chart in TCScan+. The chart below is the same as the one above, but now includes the cumulative volume curve. (The price boxes have been colored lighter to make the volume curve easier to see.) The peaks on the curve show where there has been a lot of past volume activity at that price level. For example on the chart below, you can see a lot of volume activity occurred at prices around 42, 52 and 55.

Home Video Download Purchase Help
© 2012 Rijker LLC