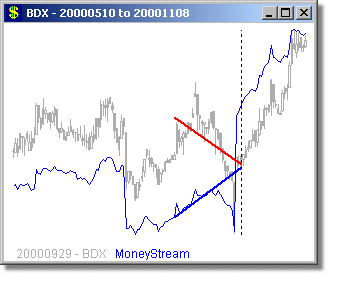
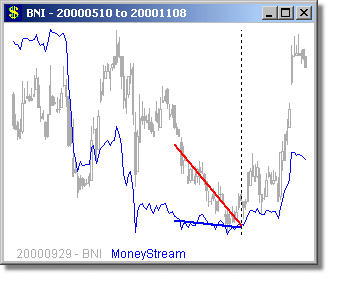
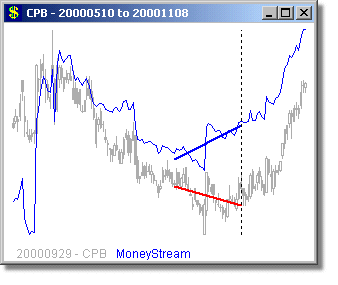
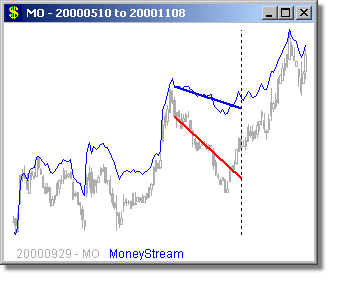
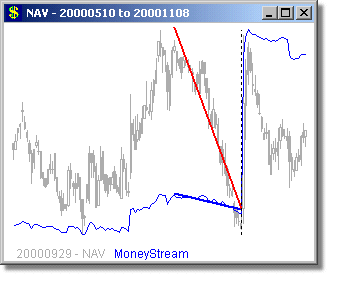
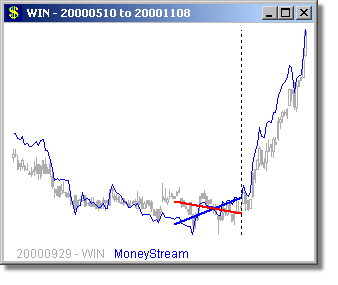
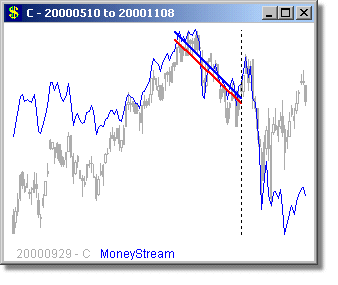
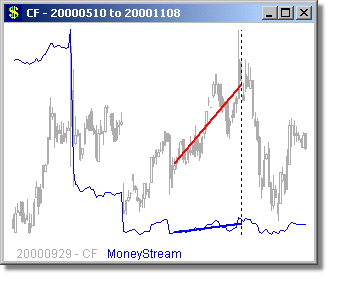
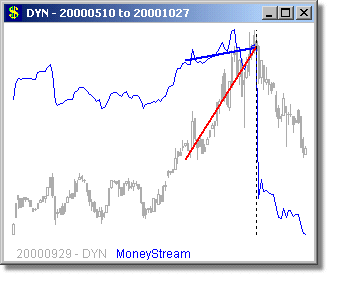
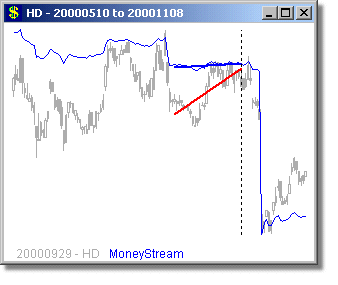
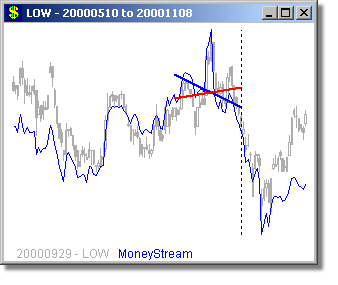
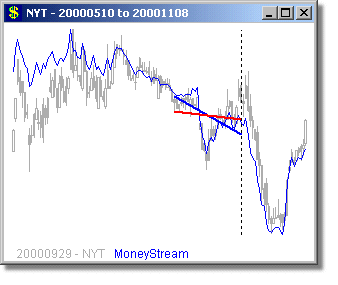
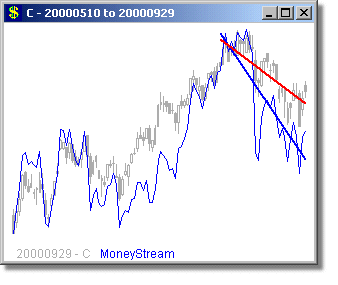
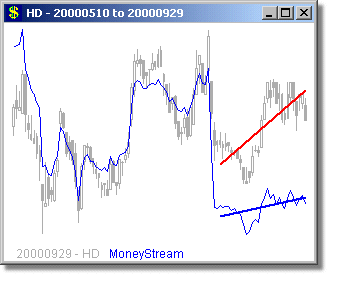
Following are some long and short examples from a MoneyStream™ Scan for September 29, 2000. We chose this day, because the DJ-30, SP-500 and COMPQX indexes were all poised for major drops from this day through Mid October - yet a MoneyStream™ divergence scan still found very good long candidates on this day (as well as short ones too). MoneyStream™ is shown in Blue and Price bars in Gray, with the Price angle line in Red. The vertical dotted line shows the day of the scan, with the plot to the right of this line showing what happened over the next 20 days.
Note the
strong positive divergences in levels and/or angles in MoneyStream™ and Price
for the long examples, and negative divergences for the short examples. As
in all good trades, judicious use of stops would have allowed good profits in
either direction over the next few days. ![]()
Long Examples
Short Examples
Home Video Download Purchase Help
© 2012 Rijker LLC