Alpha & Beta versus Correlation Coefficient
Correlation Coefficients are a statistical measure that indicate how closely two curves move in the same way. The correlation coefficient has a value between -1 and +1. Values close to 1 show that the item and reference item behave very similarly, while those close to -1 behave in an opposite manner. Values close to 0 indicate that the two items are not related at all. See Examples.
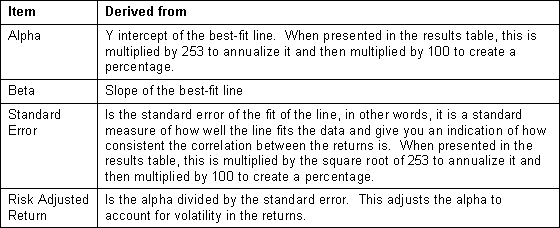
Alpha, Beta, Standard Error and Risk Adjusted Return are all derived from a plot of the daily returns of the item versus the reference. The daily return is the daily change in the item or reference and is calculated in two different ways depending on whether you have the 'Log Scaling' box checked on the Correlation tab:
Arithmetic Return: Pi+1/Pi-1
Logarithmic Return: Log(Pi+1/Pi)
Where Pi+1 is the current day's price and Pi is the price a day earlier. The price used is either the close or the average of the open, high, low and close, depending on whether you have checked the Use Close box.
The daily returns of the item are plotted versus the reference and a best-fit straight line is drawn through them. If the reference is an index, then a regular least square line (equivalent to Slope and Intercept functions in Microsoft Excel) is used but if the reference is not an index then a more advanced method is used that takes into account movement of both the reference and the current item. The alpha, beta, standard error and risk adjusted return are determined from the best-fit line as follows:

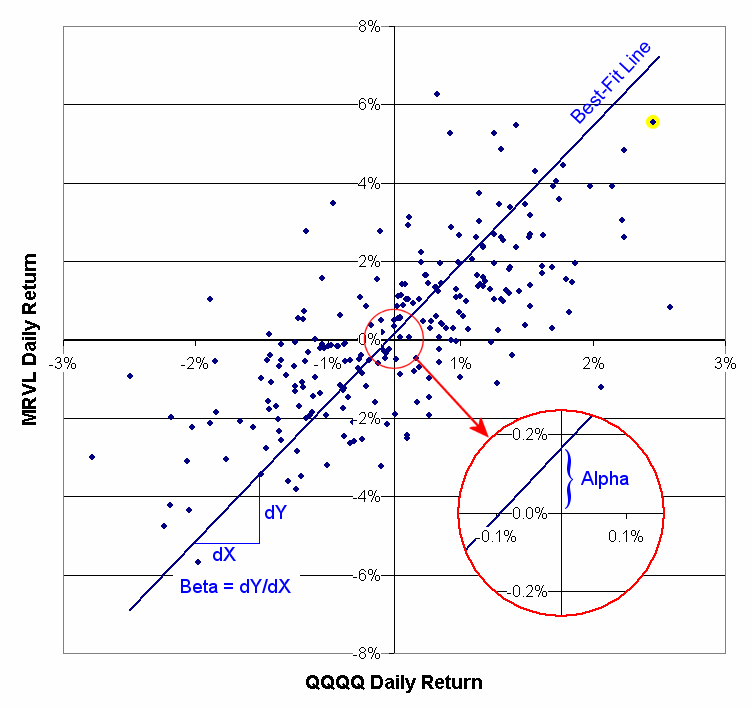
As an example, the chart below shows the daily returns of MRVL plotted against those of QQQQ. By plotted against, we mean on a particular day the daily return of QQQQ is measured along the horizontal axis and then the daily return of MRVL is plotted vertically from there. For example, consider the yellow-highlighted point near the top right of the chart. This shows a day where MRVL increased by about 5.6% from the previous day, while QQQQ increased by around 2.6%. This is done for all the days in your lookback period.

You can see that, on average, MRVL has larger daily changes than QQQQ does. This is illustrated by the slope of the line or Beta, which for the time period shown is 3.53. This means that, on average, the daily return of MRVL is 3.53 times the daily return of QQQQ. In contrast, Alpha is the Y intercept of the best-fit line, and estimates how much MRVL would change on a day when the QQQQ was flat (because it is the position of the best-fit line when the QQQQ return is 0.) In other words, alpha is the excess return of MRVL over the QQQQ or, how much extra daily income you could expect by investing in MRVL versus QQQQ. In this case the alpha is 0.17%, which annualizes to 41.9% (as would be shown in the results table.)
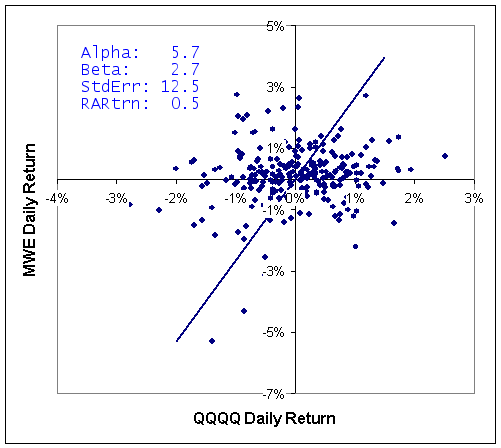
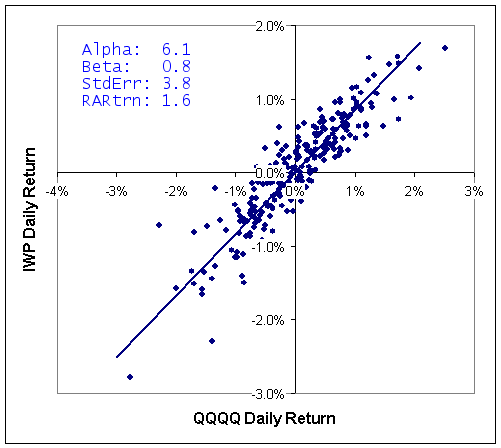
One more item is needed, however, to make a better investment decision. Consider the two returns plots below for MWE and IWP versus QQQQ. Both stocks provide a similar alpha over this time frame and MWE has a higher Beta, so tends to change in larger increments than IWP. However, looking at the left chart, you see that the points are a lot more scattered around the line than on the right chart. The scatter means that there is a lower chance that MWE will provide returns consistent with the best-fit line than IWP will. This is reflected in the standard error numbers: MWE's is 12.5% and IWP's is 3.8% and shows that MWE would be a more risky investment than IWP. Instead of looking at alpha, therefore, it is better to look at the risk adjusted return, which is alpha adjusted for the standard error. In this case, you can see that IWP offers a risk adjusted return of 1.6 versus 0.5 for MWE.

